Note
Click here to download the full example code
Multiple Figures#
Test case for putting multiple figures into sphinx gallery.
The playback file was generated using:
record_file("multifig.py", ["slider_fig", "fig"])

import matplotlib.pyplot as plt
import numpy as np
from matplotlib.widgets import Slider
# The parametrized function to be plotted
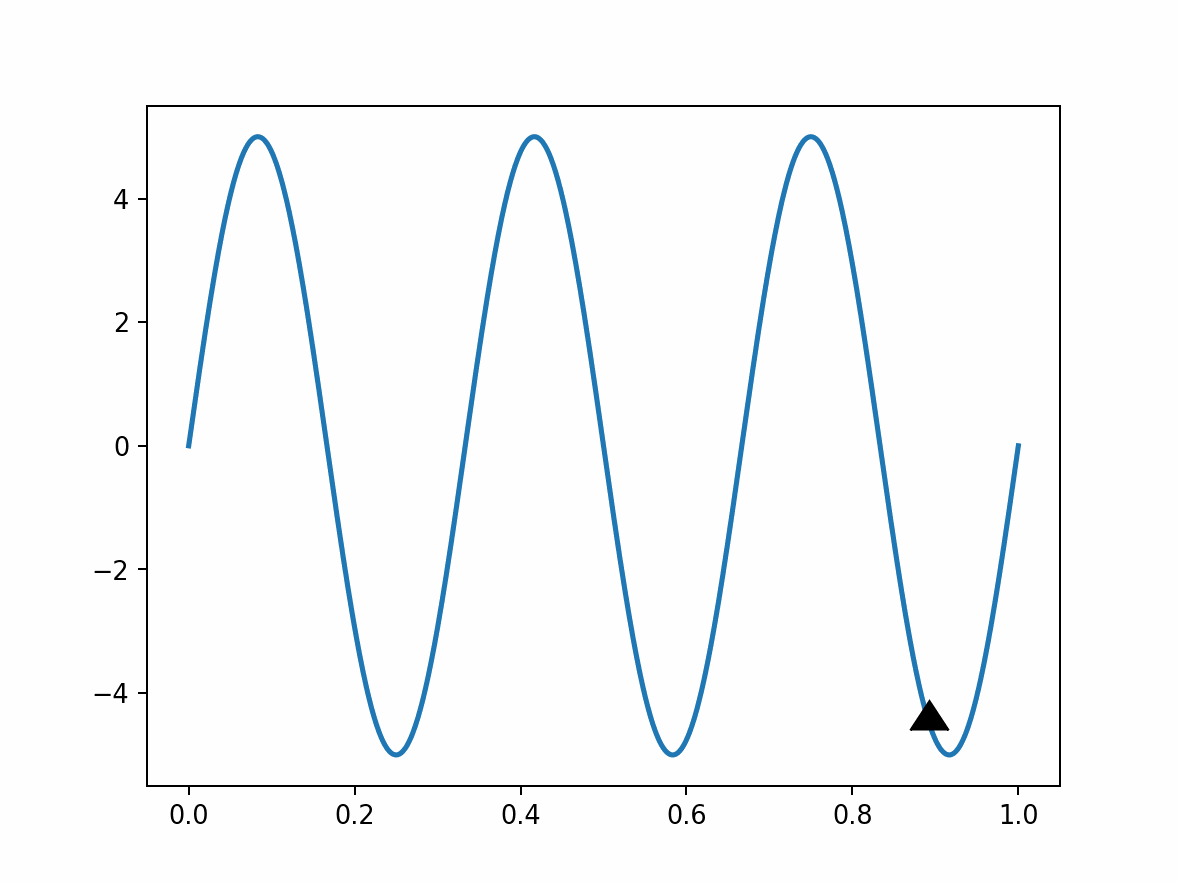
def f(t, amplitude, frequency):
return amplitude * np.sin(2 * np.pi * frequency * t)
t = np.linspace(0, 1, 1000)
# Define initial parameters
init_amplitude = 5
init_frequency = 3
# Create the figure and the line that we will manipulate
fig, ax = plt.subplots()
(line,) = plt.plot(t, f(t, init_amplitude, init_frequency), lw=2)
# The function to be called anytime a slider's value changes
def update(val):
line.set_ydata(f(t, 5, val))
fig.canvas.draw_idle()
slider_fig, s_ax = plt.subplots(figsize=(6.4, 2))
slider = Slider(s_ax, "freq", 0, 30, valinit=3)
slider.on_changed(update)
plt.show()
Total running time of the script: ( 0 minutes 27.473 seconds)