Note
Click here to download the full example code
Also supports static files#
This file is the same as An example with a recorded interaction but does not have an associated playback file, so the scraper falls back to the sphinx-gallery matplotlib scraper.


import matplotlib.pyplot as plt
import numpy as np
from matplotlib.widgets import Button, Slider
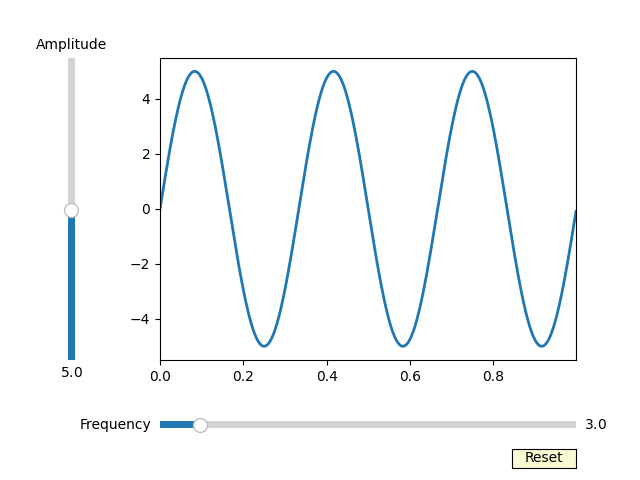
# The parametrized function to be plotted
def f(t, amplitude, frequency):
return amplitude * np.sin(2 * np.pi * frequency * t)
t = np.arange(0.0, 1.0, 0.001)
# Define initial parameters
init_amplitude = 5
init_frequency = 3
# Create the figure and the line that we will manipulate
fig, ax = plt.subplots()
(line,) = plt.plot(t, f(t, init_amplitude, init_frequency), lw=2)
axcolor = "lightgoldenrodyellow"
ax.margins(x=0)
# adjust the main plot to make room for the sliders
plt.subplots_adjust(left=0.25, bottom=0.25)
# Make a horizontal slider to control the frequency.
axfreq = plt.axes([0.25, 0.1, 0.65, 0.03], facecolor=axcolor)
freq_slider = Slider(
ax=axfreq,
label="Frequency",
valmin=0.1,
valmax=30.0,
valinit=init_frequency,
)
# Make a vertically oriented slider to control the amplitude
axamp = plt.axes([0.1, 0.25, 0.0225, 0.63], facecolor=axcolor)
amp_slider = Slider(
ax=axamp,
label="Amplitude",
valmin=0.1,
valmax=10.0,
valinit=init_amplitude,
orientation="vertical",
)
# The function to be called anytime a slider's value changes
def update(val):
line.set_ydata(f(t, amp_slider.val, freq_slider.val))
fig.canvas.draw_idle()
# register the update function with each slider
freq_slider.on_changed(update)
amp_slider.on_changed(update)
# Create a `matplotlib.widgets.Button` to reset the sliders to initial values.
resetax = plt.axes([0.8, 0.025, 0.1, 0.04])
button = Button(resetax, "Reset", color=axcolor, hovercolor="0.975")
def reset(event):
freq_slider.reset()
amp_slider.reset()
button.on_clicked(reset)
plt.show()
Total running time of the script: ( 0 minutes 0.518 seconds)